The Postcode Flood Lottery
5 Minute ReadCommon sense tells us that assessing risk at address level rather than postcode level, is more accurate. But how much more accurate?
For insurers accuracy is everything and never so more than in the area of flood risk. Many insurers assess risk at the address level, however many others do so at postcode level. What difference could it mean to the bottom line of an insurer?
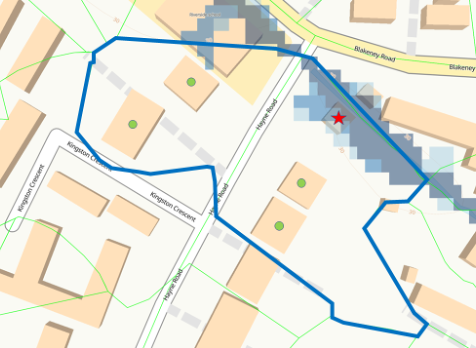
Figure 1. Properties in a postcode (blue outline) that has a significant flood risk (blue shading). Do all properties share the same flood risk? Insurers who use postcode flood risk analysis will think so and would decline the ‘safe’ opportunities (green dots).
On average a postcode contains around 12 properties. So, does that make address level analysis twelve times more accurate? No of course not. But it does have a significant impact on the property flood risk rating by an insurer and we can measure and explain that by looking at a flood risk at a national level.
We have around 1.7m postcodes in the UK and approximately 32 million addresses, the vast majority of these are not at risk of flooding.
To understand the flood risk of a property, the majority of UK insurers use JBA Flood data as their primary risk selection and pricing mechanism. JBA provide flood scores at 5m ground spacing intervals, with values between 0 and 53. We shall analyse how JBA’s data profiles across the UK property stock.
Insurers' underwriting thresholds vary according to their risk appetites but commonly land in the 9 to 12 score range for the average insurer. As we saw earlier whether this decline score is applied at a postcode level or a property level is critical.
So, nationally (see table below) at this score of 9, some 2.96m properties (6.8%) would be declined if this is applied at a postcode level, but only 1.43m (3.2%) would be declined at the property level. In raw number terms, over 1.1m more properties could be accepted if address level selection is used.

For scores of 5-8 inclusive, this is typically the range where the flood premium will be loaded or special terms applied to the policy. The 5-8 range accounts for 1.7m properties when analysed at address level (5.3%), though when analysed at postcode level the volume of referrals increases to 5.2m (16.7%). This represents a significant proportion of any insurers book.
The Accept band with scores of 0-4, is by far the biggest group, accounting for 91.5% of properties when analysed at address level. When comparing that at postcode level, it only accounts for 76.5% of properties. In raw number terms that’s a difference of over 5m properties.

These numbers prove the benefit of implementing a property level approach to risk selection, the highlights being:
- 5m more properties can be automatically accepted.
- 3.6m fewer properties require terms to the loaded.
- 1.1m fewer properties will be automatically declined.
Nevertheless, many challenges exist to operationalising address level risk selection at point of underwriting and to do this consistently across all distribution channels. The challenges include:
- Many software and data vendors still promoting postcode-based products.
- Brokers are coming to terms with the need to provide better data, however bordereaux submissions with postcode level data are still prevalent.
- Access to peril scores via API is becoming commonplace, however many brokers continue to prefer flat postcode files in order to eyeball and/or integrate into quote and buy platforms.
- Insurers struggling to enforce data quality standards on bordereaux submissions.
- Where insurers use their own bespoke models, brokers / MGA’s are faced with having to work with multiple models for the same peril.
- Insurers, MGAs and brokers holding postcode files containing hazard scores that are out of date and are not correctly licensed.
- Re-keying of policy data remains prevalent and drives down data quality.
Best practice considerations:
- Consider either integrating claims history or investing in a second view of flood risk, in order to de-risk the possibility of being selected against. The aim is to be hard on top end risks. This represents around 1% of properties, it is therefore remains good business sense to be using multiple views to identify high risk properties.
- Ensure full address level data entry, cleansing and matching at the first point of entering the location details of the property. The principle being to enter data once, at source, and allow it to percolate through all platforms … quote and buy platforms, policy administration systems and bordereaux submissions.
- Near term technology advancements are solving the bordereaux data quality dilemma. Be sure to plan accordingly now.
- When deciding on your risk selection strategy, pick a solution that enables every distribution channel to be served with equal completeness. The key is to achieve a consistent view of risk, even though you will most likely underwrite and price differently for each portfolio.
Addresscloud’s API for geocoding, property intelligence and hazard scoring delivers:
- Accurate and up to date property level geocoding
- Complete portfolio of UK hazard models
- Automatic processing of broker submissions
- Low barrier to integration
- Sub-second speed of response
- Real time exposure aggregation at point of quote
Addresscloud in Action
See how Addresscloud services are helping our customers solve real-world challenges.